Sustainability and Climate Change Targets
In 2019 we declared a climate emergency because we recognised the urgency to do everything we can to mitigate and adapt to climate change. As part of that declaration we set ourselves a target to eliminate the use of fossil fuels across all own services and operations. We also pledged to do everything we can to support and enable the community to reduce greenhouse gas emissions across the District.
More information is provided below on how we measure our progress towards these targets and the current status of those goals.
1. Eliminate our Corporate Emissions by 2030
We are keen to lead by example by prioritising emissions reductions from our own buildings, transport and services and have set ourselves a goal of doing everything we can to reduce our emissions to net zero by 2030.
So far we have reduced our emissions by 51% since 2008/09. Some of this reduction is due to specific actions we have taken, and some is due to activities at a national level. For instance, reduced burning of coal, and increased use of nuclear energy and renewables, have reduced the carbon impact of electricity by 60% between 2005 and 2021.
There is a still a lot of work to do to meet our net zero 2030 goal. If we are to achieve complete decarbonisation, we will need to cut emissions by 348 tCO2e every year from 2019/20 onwards.
In order to make this scale of change we need to ensure that we are taking our emissions into account as part of every decision we make and also allocate significant resources to retrofit our buildings with low emissions heat, power and light. This is an ongoing challenge due to budget challenges, building types and available technology.
More than half of the Council’s emissions arise from our contractors’ activities, and this includes our waste collection, ground maintenance and leisure services. We are working hard with our contractors to reduce these emissions by setting sustainability requirements that they must follow, and requiring them to set out how they will be reducing emissions over the period of the contract.
How we calculate our emissions Toggle accordion
We have been monitoring and reporting our corporate emissions since 2008/09. Our approach to calculating our emissions is based on the Government’s guidance on energy and carbon reporting, as this standardises reporting across different sized industries and sectors. Our approach is based on an internationally recognised standard for corporate greenhouse gas accounting from the World Resources Institute and World Business Council for Sustainable Development: the GHG Protocol Corporate Accounting and Reporting Standard. It corresponds with national and international voluntary schemes such as the International Organisation for Standardisation (ISO) 14064-1, CDP, and the Climate Disclosure Standards Board’s Climate Change Reporting Framework.
Our calculations cover the six greenhouse gases covered by the Kyoto Protocol: Carbon dioxide (CO2), Methane (CH4), Hydrofluorocarbons (HFCs), Nitrous oxide (N2O), Perfluorocarbons (PFCs) and Sulphur hexafluoride (SF6). The Global Warming Potential of these gases are balanced and expressed as ‘tonnes of carbon dioxide equivalent (tCO2e)’.
What emissions are included Toggle accordion
Our corporate emissions analysis covers energy consumption from buildings, home working of staff, fuel consumption from business mileage, and energy and fuel consumption by our largest contractors which providing waste collection, grounds maintenance and leisure services on our behalf. Our emissions analysis does not include emissions from water or waste processing, procured materials, staff commuting or refrigerants and air conditioning.
Our trajectory to net zero Toggle accordion
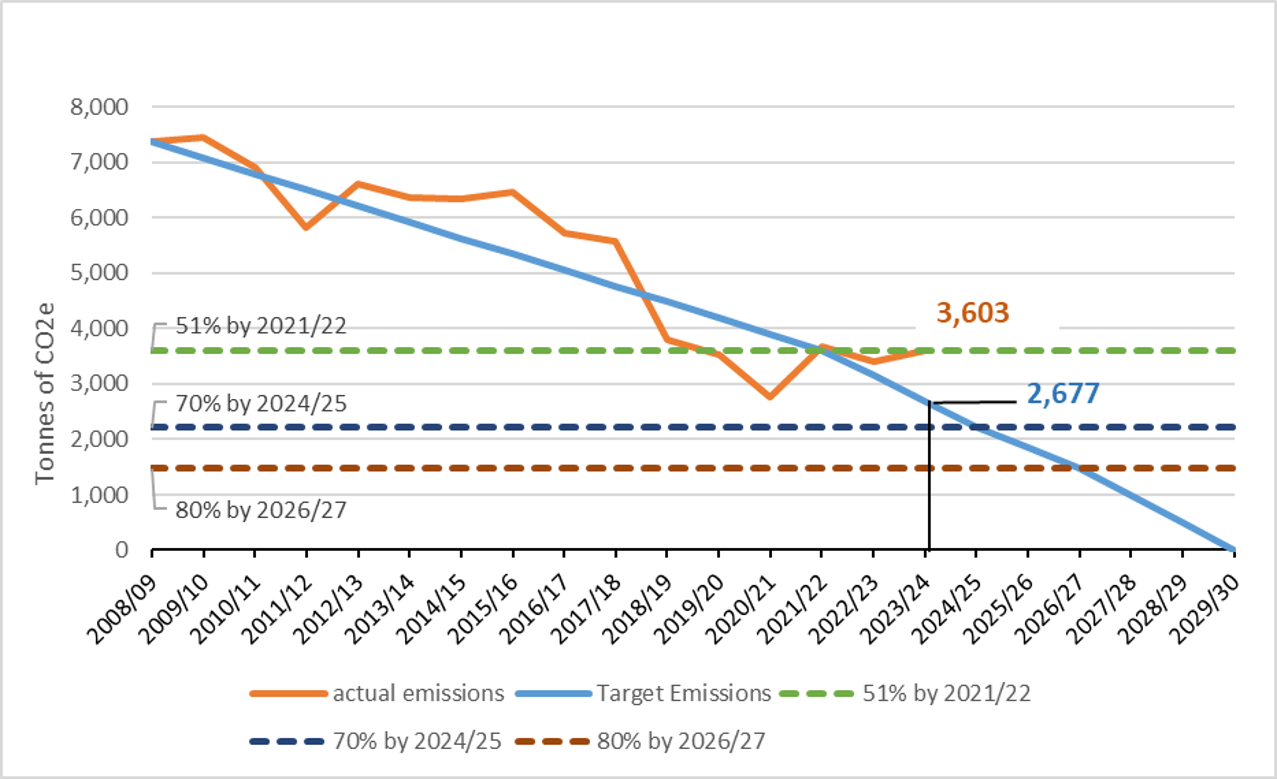
To ensure we are on track towards our net zero target, we are striving towards the following intermediary targets:
• 51% reduction in emissions by 2020/21 (compared to 2008)
• 74% reduction in emissions by 2024/25 (compared to 2008)
• 80% reduction in emissions by 2026/27 (compared to 2008)
Where we are now Toggle accordion
According to our ideal trajectory to net zero 2030, we should have emitted net emissions of no more than 2,677 tonnes CO2e in 2023/24. We therefore missed our goal by 926 tonnes.
As a result we now need to reduce emissions by 1,392 tonnes next year to catch up with our net zero trajectory. This highlights the enormity and difficulty of the challenge.
The full Corporate Emissions Report for 2023/24 is provided below.
2. Do what we can to support a carbon neutral District by 2030;
We will do what we can to support and encourage local residents, schools, businesses and the nonprofit sector, to cut emissions across the entire District by 2030.
While we don’t have total control over these emissions, their scale (about 100 times that of our own operations), means that it is vital that we use the levers that we do have, to create influence and action wherever we can. This includes planning and transport policy, procurement, social housing and our marketing, events and communications.
To reach net zero emissions across the District by 2030, we all need to work together to reduce CO2 emissions from energy and transport by 47,000 tonnes per year. It will require extensive community engagement by ourselves and our partners.
How we calculate community emissions Toggle accordion
We rely on data which is produced for us by the Government. The Office for National Statistics publication provides estimates of CO2 for Local Authority areas, on a calendar year basis, 2 years in arrears. This makes up part of the UK’s annual inventory of greenhouse gas emissions, which is used to monitor progress against domestic and international targets such as the Kyoto Protocol.
What emissions are included Toggle accordion
The dataset that we use includes carbon dioxide but not methane or nitrous oxides.
Currently the Local Authority dataset excludes fluorinated gases (hydrofluorocarbons, perfluorocarbons, sulphur hexafluoride and nitrogen trifluoride). These are estimated to make up 3% of national emissions.
Th data set we use includes emissions from domestic energy, road transport, waste management, industry and commercial businesses across the St Albans District administrative area. The figures exclude motorways, railways, livestock, soils, products consumed within the District, and flights by District residents and businesses. As a result, the true carbon footprint for every resident is likely to be significantly higher than the figures reported below.
Our Trajectory to Net Zero Toggle accordion
To check if we are on track we will aim for the following interim milestones
- 64% by 2025
- 84% by 2028
Where we are now Toggle accordion
Between 2005 and 2022 (the most recent year available), District emissions have been reduced by 43%. This is largely due to changes in the way the UK's grid electricity is produced, with a reduction in coal fired power stations and an increase in renewables and nuclear power plants.
The urban nature of the District, our good public transport links, lack of major industry and high population density mean that our emissions per person (3.3 tCO2) are just slightly higher than London (3.2 tCO2). The lower emissions there are due to its condensed population and excellent public transport facilities. 
A full summary analysis can be downloaded below.